
Can you really ‘pull yourself up by your bootstraps’ at school?
PISA tested over 140,000 kids. I compared the ‘rich and lazy’ ones to the ‘poor and hardworking’ kids to see who came out on top.

A few weeks ago, I published some data on curiosity, grit and growth mindset and asked which one best predicts a student’s test scores.
A child’s success in life is overwhelmingly determined by the family they come from.
Wealthy, socially-politically connected, educated, higher IQ parents. Born into a family culture of discipline and thoughtfulness.
Advancing in young adulthood on the family wealth cushion, that grants that child the security, freedom, time, and informational access to fly above the mean survival grind, …..
An individual child’s innate characteristics, or how much they’re able to “bootstrap” themselves by self-aware conscientious effort and psychological conditioning (with or without institutional education) has some impact, in some cases.
But it is NOT the overarching life success determinant for the overwhelming majority of children.
So, is the commenter right?
Getting curious about grit and growth mindset
Recently, schools have been pushing ‘grit’ – a concept popularised by psychologist Angela Duckworth, that is usually taken to mean persistence. How hard are you willing to work at something before you give up?
Before that, schools were all about Carol Dweck’s growth mindset: success comes by believing that your academic ability is malleable rather than fixed. You can improve your intelligence by working at it.
In the OECD’s PISA questionnaire, they survey hundreds of thousands of kids from across the globe. As well as testing for achievement in mathematics, reading and science, they ask about the kids’ persistence (which I equated with grit), growth mindset and curiosity.
My question: which has the strongest association with test scores?
Crunching the numbers
Over 140,000 kids across nineteen countries were asked about all three ‘social and emotional skills’ (as the OECD call them).
In that post, I ranked the top 10% in each trait as if they were countries. We’ll come back to this later. Here, I want to show the results a bit differently. If you want the full methodological detail on how I handled the PISA data, it’s in the last post. The same caveats apply here.
Let’s take the top 10% of students in grit (or growth mindset, or curiosity). What are their chances of being in the top 10% in one of the tests – reading, maths or science – versus those in the bottom 10% for grit?
This is called an ‘odds ratio’.
There are about 140,000 kids in our sample. 14,000 of those are in the top 10% in any test result. Let’s make up some numbers to show how odds ratios work.
Imagine that out of the top 14,000 students in maths, 4,000 of these are in the top 10% of grit versus 2,000 in the bottom 10% of grit. This gives us a ratio of 2. Top-10% grit students are twice as likely as those lowest on grit to be top scorers.
The baseline is obviously 1. If grit has no effect on test score, you’ll have the same number from the top 10% in grit as the bottom 10% in grit.
Anything below 1 means that it’s better to have a lower grit score.
Anything above 1 means grit (or growth mindset or curiosity) wins out.
So, how do our gritty, growth mindset and curious students compare across the three subjects?
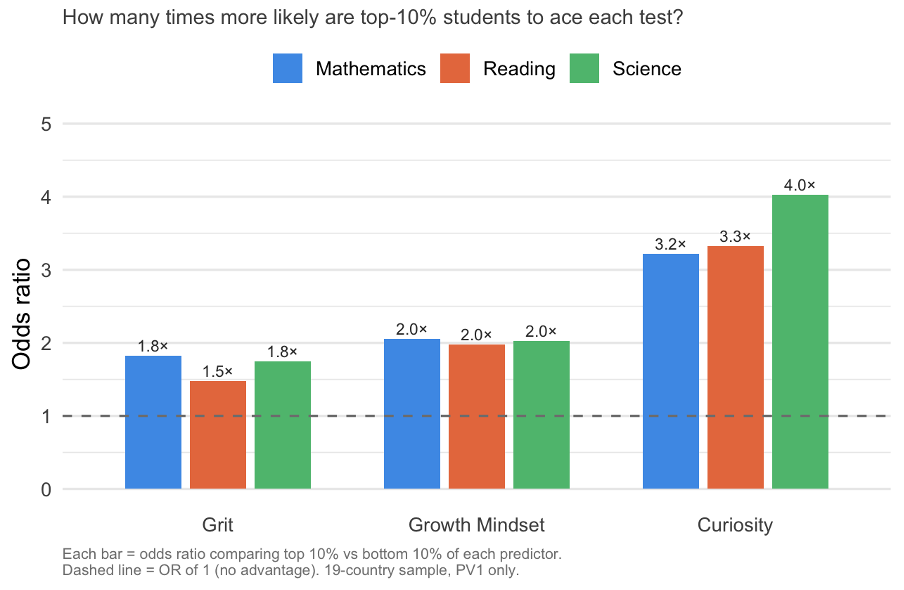
It’s good to be gritty. You’re between 50% and 80% more likely to top-score in maths, reading or science if you’re in the top 10% for grit than someone in the bottom 10% for grit.
Even better, though, to have a growth mindset: you’re twice as likely to ace the tests than someone with very low growth mindset.
Best of all is to be curious.
Those who are top in curiosity are between 3 and 4 times more likely to be found in the top 10% of the test scores than those who are lowest in curiosity.
Case closed. Why push grit or growth mindset when you could focus on curiosity instead?
But was I ignoring something with a far bigger impact than any of these?
Family circumstances
Wealth, personal connections, better educated parents with a higher IQ – we can’t test all of these, let alone a family culture of discipline or thoughtfulness.
But we can test some of them.
Let’s take household wealth: in PISA, students go through a list of 30-odd household items. Do they have a room of their own? A desk to study at? How many screens? And more categories of books than you’d ever thought about. PISA doesn’t ask about household income, but the HOMEPOS (home possessions) category is the closest thing we’ve got.
Next is students’ parents’ occupation. These are coded against a standard classification which maps each job to a prestige score. It’s a ranking system, where a surgeon would outscore a shop assistant.
We even have a category that gives us parents’ education, which asks how long each parent spent in education and takes the highest scorer (e.g., if mum did a master’s course, she’d get around seventeen years). The categorisation is too rough to get the top 10%, so we can’t include it in a fair comparison, but we will bring it in later.
Then we let the computer programme do the magic.
For household wealth and parental occupation, how many of those in the top 10% do we find at the top of the maths, reading and science charts versus those in the bottom 10%? This gives us our odds ratios.
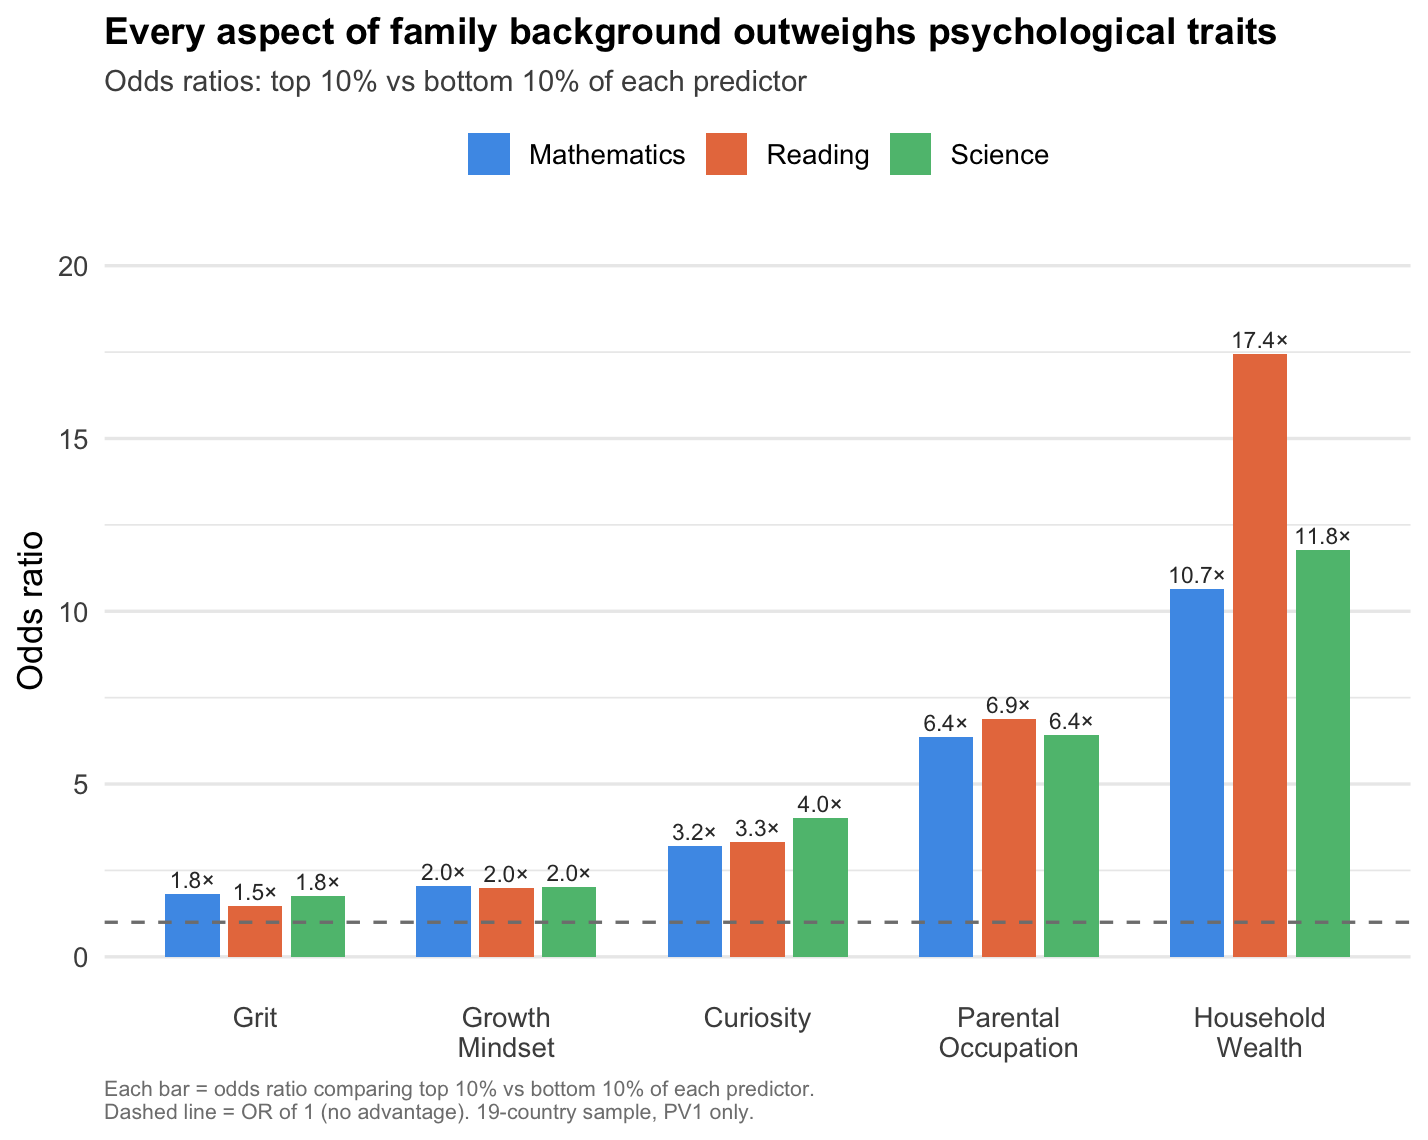
That changes things.
Curiosity, which looked so towering and impressive on the last graph, has shrunk next to parental occupation and household wealth.
If one or both of your parents are in a high-prestige job, you’ve got between six and seven times more chance of being at the top of the test ranking than someone with a low-prestige job.
And the difference is even starker with household wealth.
Those at the top of the wealth charts are between ten and eighteen times more likely to be found in the top 10% of the maths, reading and science scores.
But parental occupations and wealth are linked. Those surgeons are likely to be making much more than the shop assistants. Our measurements will overlap.
So PISA rolls it all – wealth, education and occupational status – into a single measure: socioeconomic status (SES). It’s PISA’s best single measure of family background.
If the commenter was right, we’d expect the odds from having a high SES to massively outweigh those of grit, growth mindset and curiosity.
Do they?
Family Status – the overwhelming factor driving success?
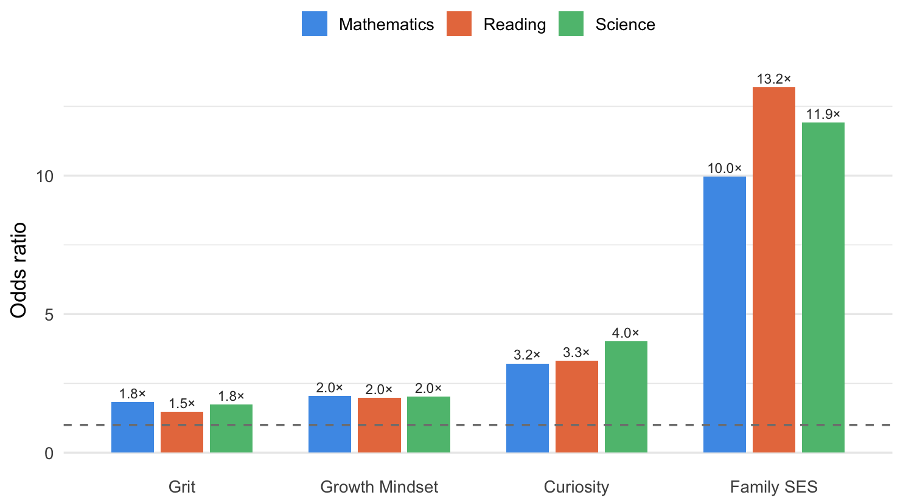
Yes.
Socioeconomic status wins out. It dwarfs any effect from grit, growth mindset or curiosity, although it’s fairly similar to the effect of household wealth (which has a much larger impact on reading scores, interestingly).
Let’s imagine that those in the top 10% for socioeconomic status were their own country and let’s plot them again the other countries in our sample, as we did last time with grit, growth mindset and curiosity.
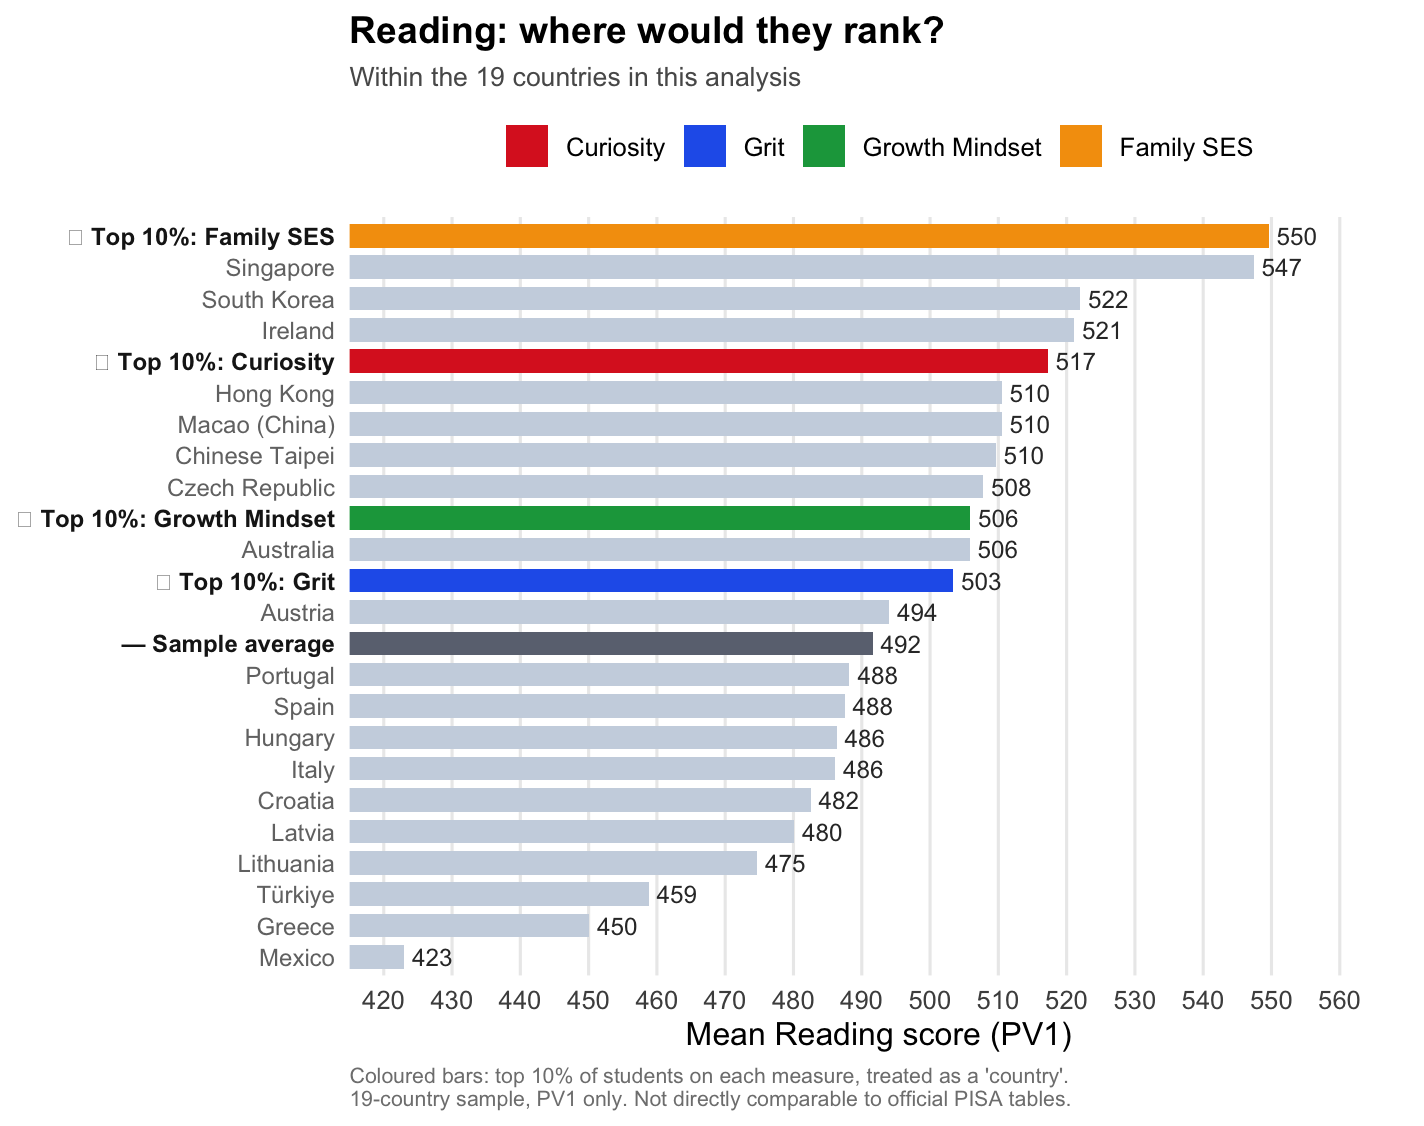
Anything that gets you above Singapore is enough to make headlines and change educational policy.
I can almost hear the education ministers clamouring: ‘what is this thing SES and how do we give our kids more of it?’
For reference, the OECD say that a score of 20 points higher on the PISA tests corresponds to about a year’s progress. That means our curious kids are a year ahead of the average kid in the sample.
Those top of the socioeconomic status lottery?
They are three years ahead of the average student (I couldn’t bring myself to plot where those in the bottom 10% would be).
I would love to say I’m the first researcher to stare at a computer and say: ‘wow, so a kid’s family background affects their test score!’ It’s such a well-known effect that unless you control for wealth (i.e. compare two kids with the same wealth), people will blame any effect you find on wealth.
Kids with more books in the home do better on tests? It’s because of their socioeconomic status.
Kids who are more curious do better on tests? It’s because of their socioeconomic status.
Kids who are born in September do better on tests? It’s because of their socioeconomic status.
In fact, it’s so well-known we’ve become almost blind to it.
Well, that’s not quite true. Many countries now spend billions of pounds a year (or whatever your local currency is) trying to reduce the effect.
In the UK, the government spends £3 billion a year on the pupil premium – extra funding for schools to close the gap between disadvantaged children and their peers.
The US has spent around $18 billion a year on Title I – its programme to close the achievement gap for disadvantaged students. A Brookings analysis found it averages around $500 per pupil, with little evidence it works. The programme currently faces proposed cuts of more than a quarter.
Ultimately, that’s why we have grit and growth mindset.
Because if we can get the poorest to try hardest, they can close that gap on their wealthy peers.
Right?
Pulling yourself up by your bootstraps?
The commenter accepted that ‘bootstrapping’ has ‘some impact, in some cases’, but was ‘NOT the overarching life success determinant for the overwhelming majority of children’.
I’m taking this to mean that if a kid works hard, they can ‘pull themselves up by their bootstraps’ and overcome disadvantage.
We can test this, too.
I’m going to use some provocative language to make a point.
I know these are real (albeit anonymous) kids and I have no idea what’s going on in their home lives.
But I want to test the claims we make about whether kids really can ‘pull themselves up by their bootstraps’, in the way the commenter described.
So let’s take two groups. The first, I’m going to call ‘rich and lazy’. These are in the top 25% of family SES and the bottom 25% for grit. (Top/bottom 10% would give us too few students, but 25% gives us about 8,000, which is a fairer comparison with our other groups.)
It’s worth noting that we can’t directly test the effort these kids are willing to put in (except, e.g. by how much of the questionnaire they bothered completing…). I’m using their self-reported perseverance – whether they agree with statements like, ‘I complete tasks even when they become more difficult than I thought.’
Then we’ve got the ‘poor and hardworking’. These are the bottom 25% for SES and the top 25% for grit.
Can the ‘poor and hardworking’ kids really outperform their richer counterparts who are low on grit?
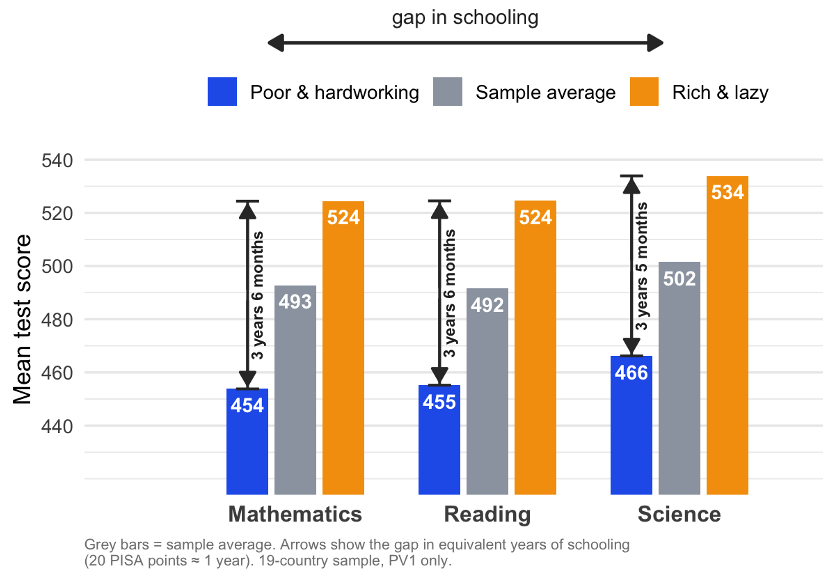
No, in short.
Nowhere near.
Remember, 20 points is about a year of schooling, so the poorer kids can be near the top in grit and yet be several years behind their richer counterparts.
What about those odds ratios we saw earlier?
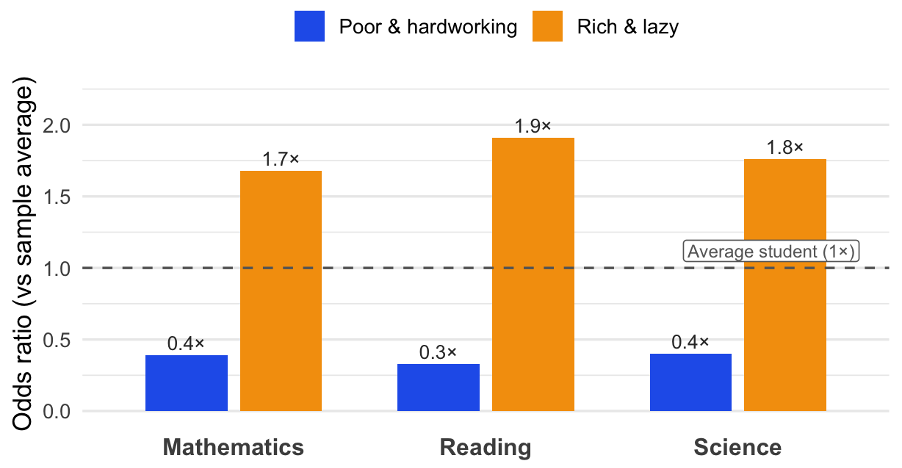
Rich, lazy students are over-represented in the top of each test score, even compared to the average student. The poor and hardworking students are an endangered breed at these rarefied altitudes.
But a sceptic might wonder if this is fair.
Maybe all the rich and lazy kids are concentrated in a couple of countries like… Spain and Australia.
(And they’d be right, to a degree. More than a third of the ‘rich and lazy’ kids – by this measure – were Spanish or Australian!)
So we can check the gap in each country separately. Does it hold even within one society and one education system?
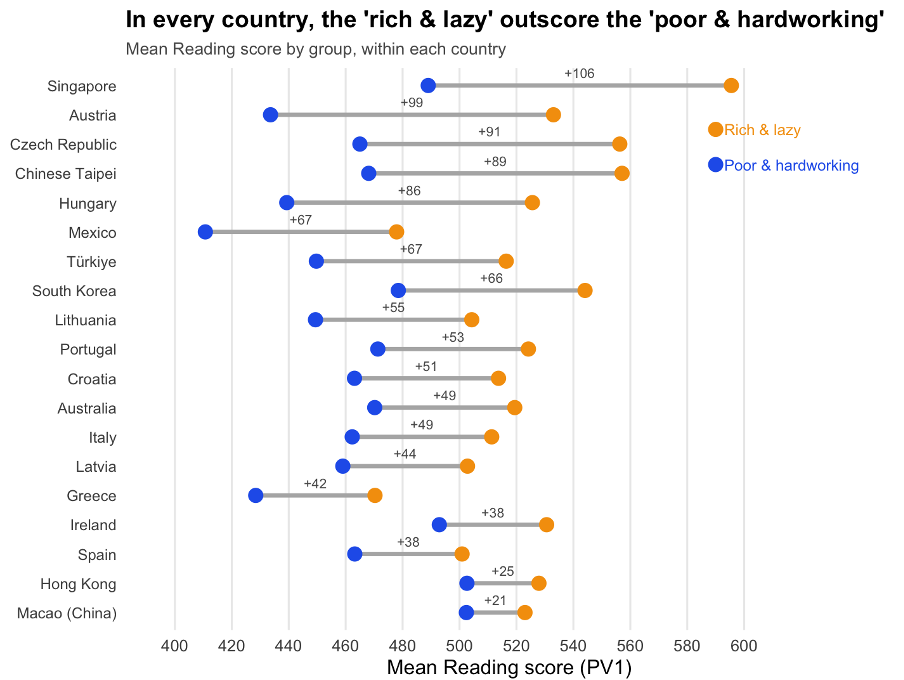
In all 19 countries in our sample, across each subject, the privileged students who don’t try hard outscore the disadvantaged students who do.
The average gap is 53 points: roughly two and a half years of schooling.
Tipping the table in your favour
This isn’t some quirk of the PISA data. A meta-analysis of 240 studies – including over 100,000 students in total – found intelligence is the strongest single predictor of academic achievement.
In the US, the SAT correlates so well with IQ scores it can be used as a proxy. In the UK, a child’s score on a cognitive abilities test at age 11 predicts their GCSE results at 16 with striking accuracy.
And the link between social class and exam performance runs partly through the schools themselves – schools with wealthier intakes recruit and retain better teachers.
Put on a few inches and you’ll be shooting hoops in no time
The PISA data – and the other studies I’ve shared – bear the commenter out. But there are caveats. Growing up in a wealthy household doesn’t guarantee success, it just makes it (considerably) more likely.
Second, I see the concerns about ‘conscientious effort and psychological conditioning’. This is my worry with mindset interventions – they can only go so far; often, that’s not very far at all.
More importantly, we should ask why we use them as a crutch.
We claim that people just need to try harder to get the top grades when the effect of perseverance on scores is massively outweighed by factors such as IQ and socioeconomic status.
Sure, you can work hard and be successful, but when you’re from a disadvantaged background, the odds are against you.
From this view, the education system feels a bit like everyone is being asked to play in the NBA when they grow up. Every kid has to attend coaching academies; if they’re not getting enough baskets, the coaches tell them to carry on their stretches at home and keep taking their vitamin supplements to make up those inches on the tall guys. One day, if they just try hard enough, they’ll be playing in the big leagues.
But basketball is entertainment. We all accept it’s biased towards the tall. Welcome to the world of sports.
School should be different. Everyone plays, whether they want to or not, and it determines your life chances, as we’re always told.
So we have a moral obligation to ask uncomfortable questions.
Especially the fundamental one: is the system fair?
If we don’t think it is (and we don’t, because we spend billions each year looking for ways to sort out the fact that poorer kids are at a huge disadvantage), are grit and growth mindset interventions enough to fix it?
At some point, the questions have to get bigger.
Nobody chooses their IQ. You can’t decide to be born into a wealthier family. Even how hard you’re willing to try is affected by your genes and environment – neither of which you choose.
So what is the point of school?
Partly, as economist and education scholar Alison Wolf argues, it’s a signalling system – a way of ranking kids to work out who gets the best jobs. But the measure has become the purpose.
Which might explain why the interventions we reach for – grit programmes, growth mindset workshops – are always about helping individual kids run faster in a race that’s already been fixed.
Rather than asking whether the race is worth running, we just tell the slower runners to try harder.
It’s time to get curious about what school could look like if exam results weren’t the whole point of it.